CirrusCentral Manager User Guide
Version: MN011056A01-D, System Release: AN2025.HS, AN2025.1, AN2024.HS, AN2024.1, Release Date: February 2026

Version: MN011056A01-D, System Release: AN2025.HS, AN2025.1, AN2024.HS, AN2024.1, Release Date: February 2026
This manual provides information about the CirrusCentral Manager, which is a cloud-based system management tool that enables you to remotely manage your radio system.
| Related Information | Purpose |
|---|---|
| Standards and Guidelines for Communication Sites | Provides standards and guidelines that should be followed when setting up a Motorola Solutions communications site. Also known as R56 manual. |
| System Overview and Documentation Reference Guide | Provides an overview of the new features, technical illustrations, and system-level disaster recovery for the ASTRO® 25 radio communication system. |
| Dynamic System Resilience User Guide | Provides information necessary to understand, operate, maintain, and troubleshoot the Dynamic System Resilience (DSR) feature that adds a geographically separate backup zone core to an existing zone core to protect against catastrophic zone core failures. |
CirrusCentral Manager is a cloud-based system management tool that enables you to remotely manage your radio system. You can log on to the CirrusCentral System Manager from your company-issued devices (such as laptop or mobile devices).
The System Monitoring screen, allows you to access the information about the topology, alarms, events, performance, affiliations and channels.
You can access the System Monitoring screen by clicking the  icon.
icon.
The Overview tab, displays the health status of the sites in a particular zone. The different colors displayed on the site wheel correspond to the following highest alarm severity at the site:
By default all sites, including console sites and conventional subsystems, are displayed on the screen. To display trunking RF sites only, you can disable other types of sites on the panel located below the site wheel.
For Dynamic System Resilience (DSR) systems, information about operational state for each core (primary and backup) is displayed.
It is possible to have different services active in different cores (primary or backup). For example, you can have Provisioning Manager connection in one core and Packet Data Gateway in the other. However, in the Overview tab, only the status of the Zone Controller is displayed. If you want to check the status of another service (for example PDG), you need to click its corresponding core on the diagram to view the details..
If you want to access more information about a particular site with a critical or major alarm, you can click this site to open a side panel on the right side of the screen. The side panel displays the information about the alarms, events, performance, channels and configuration.
The TRENDS section of the Overview tab, also allows you to monitor the call activity and the most recent alarm that occurred in the zone. You can adjust the time range by using the Time range drop-down menu.
The LOAD section of the Overview tab also allows you to monitor the current load of the sites within a zone. The sites are ordered according to the following criteria:
Only available for systems with CirrusCentral Core fallback option.
You can change this setting by selecting Custom set and clicking Edit.
When the credentials are assigned to site devices, CirrusCentral Admin users can rediscover the sites by navigating to System Monitoring → Overview, selecting a site, clicking the  icon and selecting Rediscover Site.
The sites discovered by CirrusCentral Manager have additional capabilities. For more information, see Executing Remote Commands and Performing Management Operations on Individual Devices.
You can use Topology tab to view your entire system hierarchy, navigate the system tree, and access information about the fault cause.
You can use the Alarms tab to access a list of all active alarms in the system.
You can filter the list of alarms by location and severity, or search for specific alarms by using the search feature.
You can reduce alarm flooding by grouping related items.
You can sort through alarms and events with predefined groups or your own customized groups.
You can use the Events tab to access a chronological list of the alarms and events that happened on the radio system.
You can use the Performance tab to access the call activity and affiliations graphs.
Call activity graph shows the recent trend of active and busy calls in the system. You can use the Time range drop-down menu to choose the period of time for the displayed calls. You can choose between the last two minutes and the last hour.
Affiliations graph shows the number of radios and talkgroups on the particular sites.
You can use the Affiliations tab, to check the talkgroup affiliation of radios and consoles.
You can use the Affiliations tab to search for your consoles, radios, and talkgroups position by using the consoles ID or alias.
You can also use the Affiliations tab to determine the last used site and talkgroup for the radios that are turned off or deregistered. The displayed time of the last radio activity is typically the time when the radio was deregistered, turned off or lost.
You can use the Channels tab to monitor real-time call activity, trunking status, channel utilization and affiliations on your system.
The integrated channel faults feature enables you to instantly be alerted to potential channel issues.
The sites are ordered according to the following criteria:
You can change this setting by selecting Custom set and clicking Edit.
You can access the Anomalies screen by clicking the  icon in the top right corner of the screen.
The Anomalies screen displays the number of anomalies discovered in the last 72 hours. The number of notified detections is limited to 50 most severe anomalies.
After the system collects enough data, an onboarding icon and a tooltip are displayed.
The talkgroup anomalies are prioritized over other types of anomalies. The Anomalies screen lists a maximum of 10 talkgroup anomalies.
The following information is displayed for each anomaly:
To see more information about a given anomaly, you can click the anomaly icon. The following information is displayed after clicking the anomaly icon:
You can manage each anomaly by performing the following actions:
The acknowledged anomaly is no longer displayed on the Anomalies screen.
 icon.
icon.You can access the System Configuration screen by clicking the  icon.
icon.
You can use the Radios tab to:
You can use the Talkgroups tab to access basic information about talkgroups defined in the system and assign talkgroups to agencies.
You can use the Sites tab to access information about all RF sites in the system, their configuration status and contextual information about all aspects of the site configuration, fault, and performance. You can display the information in the Sites tab in a tree view.
CSV file format, edit it and then upload the list back to the CirrusCentral Manager.
CSV file, are saved in the decimal format. You can assign the location and timezone of the desired site in the CirrusCentral Manager before the export. This site can serve as an example that you can use when you add the location and timezone to the other sites.
You can use the Channels tab to access information about all RF channels in the system and contextual information about all aspects of the site: configuration, fault, and performance. You can display the information in the Channels tab in a tree view.
You can use the System tab to access information about all system level configurations.
The system levels configurations are aggregated in functional areas, with descriptions available contextually.
You can use the search feature in the System tab to search for system parameters. You do not need to enter a full name of the system parameter into the search field for the CirrusCentral Manager to find it.
You can use the Configuration Repository tab to manage system network configuration changes.
The System Inventory tab aggregates all devices in the system in one place.
You can use the System Inventory tab as the central and starting point for infrastructure configuration management that provides you with contextual access to other aspects of the devices.
You can use the System Inventory tab to download the system inventory in the CSV file format.
You can use the System Inventory tab to check the software versions for transport devices, RF sites devices, and core servers.
For DSR systems, DSR core status and redundancy status for each device are displayed.
CirrusCentral Manager classifies firmware versions of transport devices in the system as recommended, supported and not supported. You can use the Find feature to search for devices with the desired firmware version. The devices with not supported firmware version are marked with a red dot.
You can access the System Insights screen by clicking the  icon.
icon.
You can use the Availability tab to access information about historical downtimes on the system or specific sites.
The data is presented either as a time trend, or aggregated availability for a selected time period.
You can access data for up to five years back.
The maximum available time range to display information in the application is one year.
With the system utilization report you can monitor in detail how your system is used. To make the full use of the report, you need to assign sites, radios and talkgroups to agencies.
You can generate the system utilization report for a system, sites, or agencies by selecting the System, Sites, or Agencies filter displayed on the right side of the System Utilization tab. To further break down the data, from the View by drop-down menu on the left side, you can select Time, Site, Users, and Agency.
Agencies are a subset of sites and/or a fleet that are assigned to a particular agency within CirrusCentral. Agency Partitioning must be set up in the Settings for data to populate within the Agency filter. See Applying Agency Partitioning to Sub-Agencies.
| Context: | View by: | System Utilization tab capability |
|---|---|---|
| System | Time |
Check the utilization of channels (talkpaths) across the whole system over time with a breakdown by a type of calls.
Use cases:
Note: Total utilization includes the control channel.
|
| System | Sites |
Check the utilization of channels (talkpaths) for sites in the system.with a breakdown by type of calls and total utilization.
Use cases:
Note: Total utilization includes the control channel.
|
| System | Users | Check the number of radio users registered in the system over time. The data shows the maximum, minimum, and average number of users with the amount of utilization generated by those users. Use cases:
|
| Sites | Time |
Check the utilization of channels (talkpaths) for a single site, zone, or group of sites over time with a breakdown by a type of calls.
Use cases:
Note: Total utilization includes the control channel.
|
| Sites | Sites |
Check the utilization of channels (talkpaths) for selected sites or sites. For each selected site, the system utilization report provides a breakdown by type of calls and total utilization.
Use cases:
Note: Total utilization includes the control channel.
|
| Sites | Users | Check the number of radio users registered on a site, zone, or subset of sites over time. The data shows the maximum, minimum, and average number of users with the amount of utilization generated by those users on a selected site or sites. Use cases:
|
| Agencies | Time | You can check the utilization of channels (talkpaths) by traffic of selected agencies TG in the system over time with a breakdown by a type of calls. Total utilization does not include the control channel. This context is recommended for systems in which agencies own their sites. Use cases:
|
| Agencies | Sites | Check the utilization of channels (talkpaths) for sites assigned to a selected agency or agencies. For those sites, the system utilization report provides a breakdown by a type of calls and total utilization.
Note: Total utilization includes the control channel. This report is recommended for agencies owning their sites.
Note: Traffic from other agencies on the assigned sites is included.
Use cases:
|
| Agencies | Users |
You can check the number of radio users registered on sites assigned to selected agencies over time. The data shows the maximum, minimum, and average number of users with the amount of utilization generated by those users on assigned sites. This report is recommended for agencies owning their sites.
Use cases:
Note: Users from other agencies registered on assigned sites are included.
|
If you View by Agency, the following information is applicable:
The Show without utilization toggle turns on/off the agencies that did not generate any traffic.
You can use the Sort by drop-down menu to sort the agencies on the chart and in the table. Available options allow to sort the agencies high to low, low to high or alphabetically.
The table for each agency shows a total utilization percentage against the total available air time and total air time used (in brackets). This is further broken down in the subsequent columns to utilization for group, private, data and emergency calls.
When downloading this report to a .csv file, the table data for percentage and air time for each agency is put in a separate column to allow for efficient filtering and analysis with external tools. In the .csv file the air time is presented in seconds.
If you want to analyze the utilization of your systems for a subset of agencies, you can use the Agencies filter on the right side of the System Utilization tab and from the View by drop-down menu on the left side select the required agencies.
If you want to analyze the traffic by agencies on a site (or a subset of sites) you can use the Sites filter and select them from the View by drop-down menu.
You can use the Billing tab to access information about the number of talkgroup calls and PTTs performed on different talkgroups or by different agencies.
You can access data for up to five years back.
The maximum available time range for a single report download is one year.
The maximum available time range to display information in the application is three months.
You can use the Radio Activity tab to access information about radio or talkgroup registrations, affiliations, and site switches. You can also filter the displayed information by sites, talkgroups and single radios.
You can access data for up to three months back.
The maximum available time range for a single radio report is one month.
The maximum available time range for sites and talkgroups report is 72 hours.
You can use the Fault History tab to access historical fault alarms and events data.
You can filter the displayed information by time range, location, manager resource, severity, and text.
You can access data for up to two years back.
The maximum available time range to display information in the application is one year.
You can use the Call Activity tab to troubleshoot calls on a specific talkgroup and in a specified time range.
You can access data for up to three months back.
The maximum available time range to display information in the application is four hours.
You can use the Communication Issues tab to access information about the Busy and Reject communication issues.
You can access data for up to three months back.
The maximum available time range to display information in the application is one month.
The CirrusCentral Management Cloned Radios report analyzes the stream of radio activities (ATIA) in the system and finds possible cloned radios based on high confidence patterns. The analysis is done in two separate flows:
The following are the radios that might be marked as cloned:
The probability that radios are cloned is higher for the radios with frequent number of detections and regularity.
The following are the supported detection patterns of cloned radios:
You can access data for up to five years back.
The maximum available time range for a single report download is one year.
The maximum available time range to display information in the application is three months.
You can use the report scheduling feature to schedule repeatable reporting activities. When a report is generated, an email notification that prompts you to download the report from the CirrusCentral Manager is sent.
The report scheduling feature is available to the following users:
You can schedule the following report types:
.pdf and .csv).pdf and .csv).pdf and .csv).pdf and .csv).pdf and .csv).csv only).pdf reports serve as a summary of the data selected in the report. The .csv are intended for the users who require the data for the troubleshooting operations.
For information on how to schedule reports, see Scheduling Reports.
| Report Type | Maximum time range | Maximum available time range for generation* |
|---|---|---|
| Availability | 1 year | 3 years |
| System Utilization | 1 year | 3 years |
| Billing | 1 year | 3 years |
| Cloned Radios | 1 year | 3 years |
| Radio Activity (system context) | 72 hours | 3 months |
| Radio Activity (single radio context) | 1 month | 3 months |
| Communication Issues | 1 month | 3 months |
| Call Activity | 4 hours | 3 months |
| Fault History | 1 year | 2 years |
| *The earlier data is not removed, but it is not accessible through the current report generation capabilities. | ||
You can use the CirrusCentral Manager Map screen to view your system from a geographical perspective.
You can access the Map screen by clicking the  icon.
icon.
You can use the Map screen to:
You can use the Job Management screen to access a list of all configuration management jobs. You can filter the displayed information by status, type, time range, originator, or search for specific jobs by entering appropriate information in the search field.
You can access the Job Management screen by clicking the  icon.
icon.
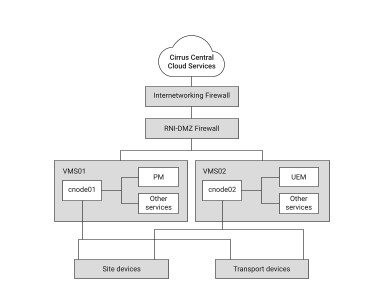
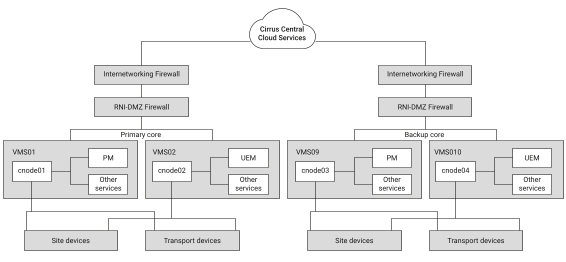
You can use the Node Connection Status screen to monitor the status of connectivity between ASTRO Core and CirrusCentral cloud services.
When the DSR feature is implemented in the system, this screen shows whether the ASTRO 25 core is connected with the cloud through Cirrus Nodes deployed on Virtual Management Servers in the primary core (VMS01 and VMS02) or Virtual Management Servers in the backup core (VMS09 and VMS10).
A service must be connected both to the ASTRO 25 system and CirrusCentral cloud to be operational.
You can access the Node Connection Status screen by clicking the  icon.
icon.
You can use Audit Viewer to monitor user activity performed in CirrusCentral Manager.
You can access Audit Viewer by clicking the  icon.
icon.
You can access the Settings screen by clicking the  icon.
icon.
You can use the Agencies tab to:
You can use the Users tab to create, delete users and assign or restrict access by assigning agency and roles to the users.
For more information about the CirrusCentral Manager roles, see Predefined CirrusCentral Manager Roles.
You can use the Monitoring Settings tab to configure alarm severity fault notifications through SMS or email and to configure alarm aggregation rules.
You can use the Device Accounts tab to create, edit and assign device accounts that are used to manage the devices.
CirrusCentral Manager requires the defined accounts to communicate with devices.
The following are some of the available accounts:
Dedicated connections to the devices require new credentials. CirrusCentral Admin users can manage the credentials by navigating to Settings → Device Accounts and selecting a user account.
Currently, only the SNMPv3 and SSH are supported.
The following protocol types are currently supported:
The following are the standard call processing features for CirrusCentral Manager. They are available if you deployed CirrusCentral Manager as a backup for a Primary ASTRO Core:
The following is a list of constraints:
In ASTRO® 25 systems, Dynamic System Resilience (DSR) adds an additional, geographically, separate ASTRO® 25 core to protect against catastrophic failures. DSR provides redundancy for voice, network management, data and information assurance services. In the event that remote sites cannot connect with the active core, the sites switch to their Backup core. For more information on DSR feature, see Dynamic System Resilience User Guide.
Activation of this functionality requires Cirrus Node virtual machines deployment in the backup core. To deploy Cirrus Node virtual machines, contact Centralized Managed Support Operations (CMSO). Internet connection at your DSR core is required.
If the one source of data about device health (for example UEM in primary core) fails, but the second one (for example UEM in secondary core) works correctly, CirrusCentral uses the second source instead of the first. You can find the information about the data source switch on the device event tab.
To remove a site device from CirrusCentral, first you need to remove it in other Network Management applications because they are used as a source of data for CirrusCentral. When the site device is ready to be removed, on the System Inventory tab, in the Config Status column, its status changes to Ready for removal.
This chapter details procedures related to the configuration of the CirrusCentral Manager.
icon.  icon.
icon.
icon.
icon. This section provides information about the predefined CirrusCentral Manager roles and the features that are accessible to these roles. The set of features may be different for the system-level users and agency group users.
This role is only applicable for the system-level users.
The CirrusCentral Admin users can:
The inactivity timer for the CirrusCentral Admin user, is set to twelve hours.
The system-level (Root Agency) users have access to:
The following are the limitations of the agency group users assigned to the CirrusCentral Monitoring role:
The statuses and statistics for parent elements include some of the information from the child elements that are not visible for the user.
Correlated alarms are displayed only if the triggering alarm is related to site that is assigned to the agency of that user.
Aggregated alarms are displayed only if any of the alarms from aggregation is related to a site assigned to the agency of that user. Only the alarms related to a site assigned to the agency of that user are displayed under the aggregated alarm.
The inactivity timer for the CirrusCentral Monitoring user, is set to seven days.
The inactivity timer might be lower if the user is assigned to a role with a lower inactivity timer.
The CirrusCentral Technician users have access to the same set of functions as the CirrusCentral Monitoring users.
The CirrusCentral Technician users can also send diagnostic commands to the devices and perform Manage and Unmanage actions on the RF Site devices.
The inactivity timer for the CirrusCentral Technician user, is set to twelve hours.
The CirrusCentral Provisioning system-level users can configure all radios and talkgroups in the CirrusCentral Manager and assign them to agency groups.
Agency group users also can only access the radios and talkgroups that are assigned to their agency group. They cannot reassing radios or talkgroups to different agency groups.
The inactivity timer for the CirrusCentral Provisioning user, is set to twelve hours.
The CirrusCentral Alias Manager system-level users can change radio aliases.
Agency group users can only change the aliases of the radios that are assigned to their agency group.
The inactivity timer for the CirrusCentral Alias Manager user, is set to twelve hours.
The CirrusCentral Infrastructure Admin system-level users can:
Agency group users have access to all the functions of the system-level users, but they can only access the sites (and their related infrastructure) that are assigned to the agency of these users.
The inactivity timer for the CirrusCentral Infrastructure Admin user, is set to twelve hours.
The CirrusCentral Reporting system-level users can:
Agency group users have access to:
The inactivity timer for the CirrusCentral Reporting user, is set to twelve hours.
This chapter details procedures related to the infrastructure configuration with the CirrusCentral Manager.
icon. icon.  icon.
icon. icon.
icon.
icon.
icon. icon.
icon. CirrusCentral Manager requires the defined accounts to communicate with devices.
For more information, see Device Accounts Tab.
The SNMPv3 security level has the following security settings:
icon. Use the security levels, user names and passwords that are used by the Unified Network Configurator (UNC) and Unified Event Manager (UEM)
Ensure that Centralized Authentication was configured for the D-Series site. See “Configuring Centralized Authentication for PCA Users” in the Provisioning and Configuration Agent User Guide.
icon.
Obtain the .zip configuration file.
icon. .zipconfiguration file by clicking Add Configuration File. icon. This does not impact the sites and devices management from the Unified Event Manager (UEM), Unified Network Configurator (UNC) and Provisioning Manager (PM).
The following sites and devices can currently be managed from the CirrusCentral Manager:
For example site controllers, base radios and comparators
The provided fault management information is gathered from the UEM, not directly from the devices.
If you discover devices for the first time and they do not have assigned credentials yet, in the Credential Settings tab of the Bulk discovery window, you must select the SNMPv3 credentials.
icon. icon. icon. icon. icon. icon. icon.
icon depends on the type of a given device and the state in which it currently is.For example, a device must first be successfully rediscovered for the Check Sync Status, Manage and Unmanage operations to appear in the drop-down menu.
icon. icon. icon, depends on the types of the given devices and the state in which they currently are.
After you select the management operation from the drop-down list, you may be prompted by one or more modal windows.
If the selected management operation is not applicable to all selected devices, you are prompted by a window with a list of included and excluded devices to confirm or cancel the operation.
You can use the Job Creation window to get more information about the applied changes. You can also use the Job Creation window to access additional options, for example job approval, comments or scheduling.
Ensure that you discovered the device or site for which you want to execute the remote command. See Discovering Sites and Devices.
icon. RF device commands are executed immediately. You can check the submission and execution of the commands on the Events tab.
Transport device commands are executed as jobs and their submission can be tracked in the Job Management section.
You can also use this procedure to find devices that cannot be configured or are in the following states:
| Config State | Description |
|---|---|
| Ready | The device configuration is managed and is synchronized with the manager. |
| Out of sync | The device configuration is managed and is synchronized with the manager. |
| Checking synchronization | Checking synchronization operation is in progress on the device. No configuration changes can be applied until the operation finishes. |
| Update in progress | Configuration change operation is in progress on the device. No other configuration changes can be applied until the operation finishes. |
| Communication issue | The device cannot be communicated for managing the configuration. Network connection may be down or credentials may be invalid. |
| Version not supported | The device version is not supported for configuration. |
| Planned | The device exists in the configuration but was not discovered in the system, You must perform rediscovery if the device is connected. See Discovering Sites and Devices. |
| Not managed | The device is discovered, but the configuration is not managed by the CirrusCentral Manager. |
| Empty | The device configuration is not yet supported by the CirrusCentral Manager. |
icon. icon. icon and by selecting, from the drop-down list, Check Sync Status.
icon. icon. icon. The values displayed on the System tab, are synchronized from the Unified Network Configurator (UNC) and UNC Wizard and can only be edited there.
If there are any changes in the configuration, a new backup is created.
If there are no changes, the backup is not created.
For more information on how to discover transport devices, contact Centralized Managed Support Operations (CMSO).
icon. icon. icon. icon. icon.  icon.
icon. This chapter details operations that can be performed with the CirrusCentral Manager.
icon.  icon.
icon.
You can perform this procedure to mute the alarms reported in CirrusCentral Manager.
icon. icon. You can perform this procedure to unmute the previously muted alarms.
icon. icon.
The Cirrus Node (CNODE) is a container execution platform that provides an environment for the execution of Cirrus connector applications. The Cirrus connector applications bridge communications between the Cirrus Central Management cloud applications and the on-premises devices.
The Cirrus Nodes operate as virtual machines on the existing Virtual Management Server. For communications with the cloud services, they operate secure protocols that are restricted by policies in the RNI-DMZ and Internetworking firewall.
The Cirrus Node is a minimalistic container execution environment built on Red Hat Enterprise Linux. It provides the ability for a variety of lightweight applications to be executed. The containers that execute on each node are defined in and distributed through the cloud/internet connection.
The Cirrus Node is cloud connected and contains functionality to obtain all OS and application container updates directly from the cloud. Motorola will publish a schedule of Maintenance Windows for when a disruptive update is expected.
The Motorola Solutions products described in this document may include copyrighted Motorola Solutions computer programs. Laws in the United States and other countries preserve for Motorola Solutions certain exclusive rights for copyrighted computer programs. Accordingly, any copyrighted Motorola Solutions computer programs contained in the Motorola Solutions products described in this document may not be copied or reproduced in any manner without the express written permission of Motorola Solutions.
No part of this document may be reproduced, transmitted, stored in a retrieval system, or translated into any language or computer language, in any form or by any means, without the prior written permission of Motorola Solutions, Inc.
MOTOROLA, MOTO, MOTOROLA SOLUTIONS, and the Stylized M Logo are trademarks or registered trademarks of Motorola Trademark Holdings, LLC and are used under license. All other trademarks are the property of their respective owners.
The purchase of Motorola Solutions products shall not be deemed to grant either directly or by implication, estoppel or otherwise, any license under the copyrights, patents or patent applications of Motorola Solutions, except for the normal nonexclusive, royalty-free license to use that arises by operation of law in the sale of a product.
This product may contain Open Source software used under license. Refer to the product installation media for full Open Source Legal Notices and Attribution content.
 The European Union's WEEE directive and the UK's WEEE regulation require that products sold into EU countries and the UK must have the crossed-out wheelie bin label on the product (or the package in some cases). As defined by the WEEE directive, this crossed-out wheelie bin label means that customers and end users in EU and UK countries should not dispose of electronic and electrical equipment or accessories in household waste.
Customers or end users in EU and UK countries should contact their local equipment supplier representative or service center for information about the waste collection system in their country.
Please note that certain features, facilities, and capabilities described in this document may not be applicable to or licensed for use on a specific system, or may be dependent upon the characteristics of a specific mobile subscriber unit or configuration of certain parameters. Please refer to your Motorola Solutions contact for further information.
© 2026 Motorola Solutions, Inc. All Rights Reserved
The Centralized Managed Support Operations (CMSO) is the primary contact for technical support included in your organization's service agreement with Motorola Solutions. To enable faster response time to customer issues, Motorola Solutions provides support from multiple countries around the world.
Service agreement customers should be sure to call the CMSO in all situations listed under Customer Responsibilities in their agreement, such as:
Your organization received support phone numbers and other contact information appropriate for your geographic region and service agreement. Use that contact information for the most efficient response. However, if needed, you can also find general support contact information on the Motorola Solutions website, by following these steps:
The Motorola Solutions (MSI) Documentation Portal is an online platform where you can find all the user documentation in one place, go to https://motr.la/docs.
You can provide feedback, questions, or comments for any publication or article by selecting the feedback icon. See Providing Feedback.
To discover the many learning opportunities within the Motorola Solutions (MSI) Learning Center, go to https://learningcenter.motorolasolutions.com/.